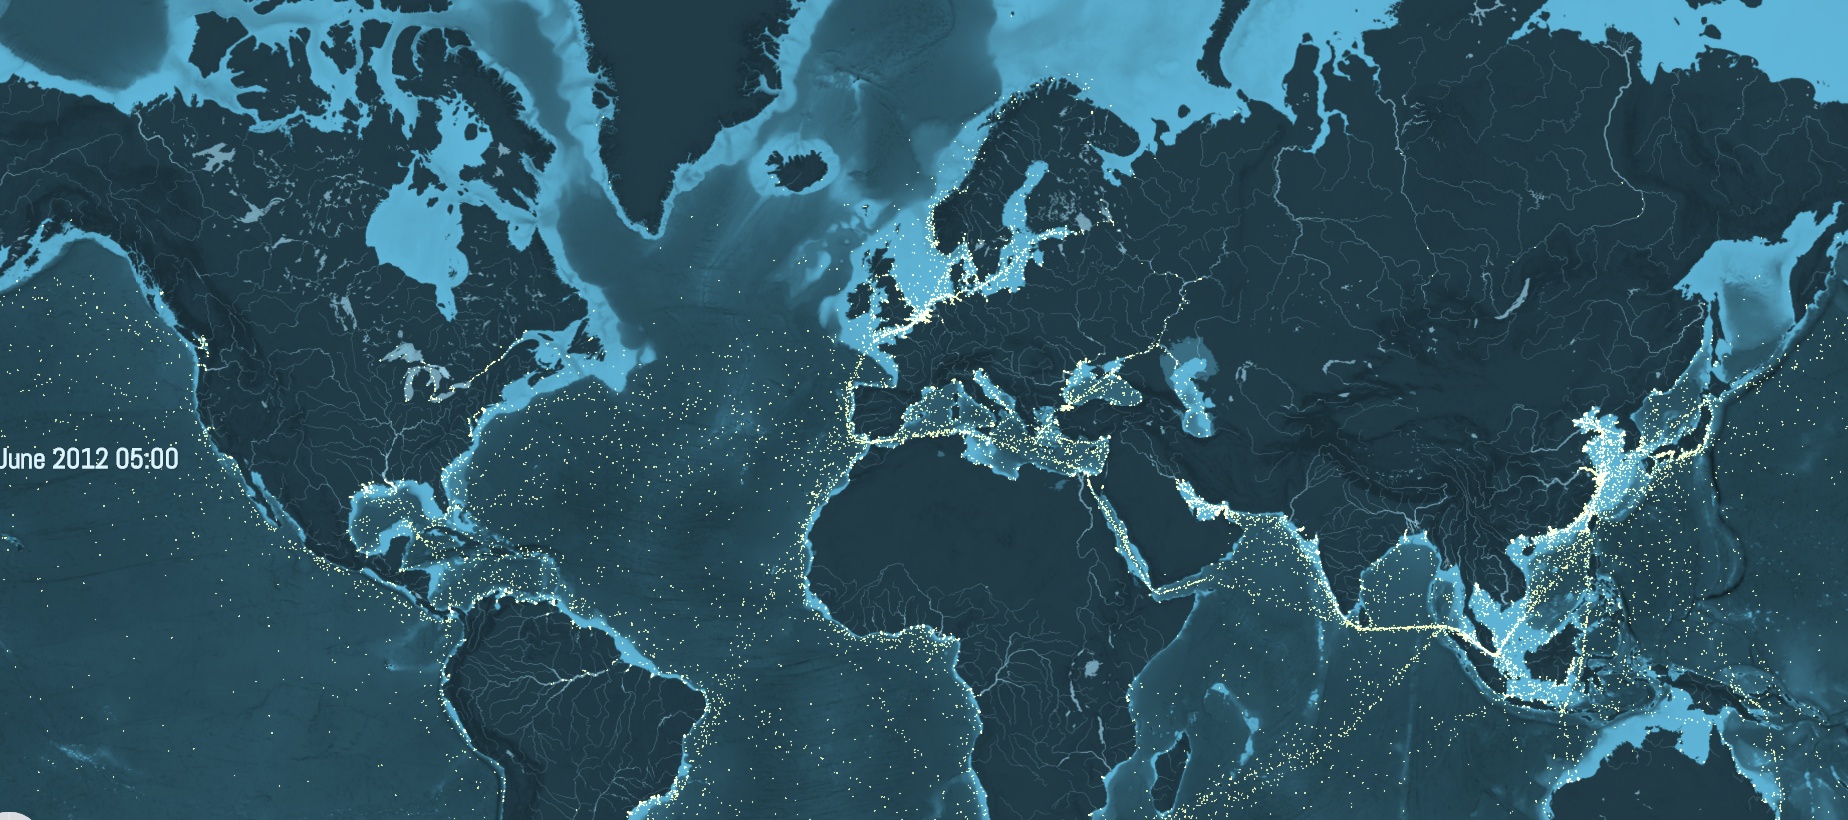
Auf diese außerordentlichen Karte ist (fast) der komplette globalen Schiffs-Handelsverkehr aus dem Jahr 2012 animiert.
Das Abspielen des Audiokommentars erklärt euch einige Auffälligkeiten.
Erstellt wurde die Karte von kiln, das sie folgendermaßen beschreibt:
You can see movements of the global merchant fleet over the course of 2012, overlaid on a bathymetric map. You can also see a few statistics such as a counter for emitted CO2 (in thousand tonnes) and maximum freight carried by represented vessels (varying units). Unfortunately the data we are using for the map is incomplete for the first few months of the year: roughly January to April.
